Comprehensive Reports
Overview (Dashboard) | Finance: Overview | Finance: Cashflow & Liquidity Planning | Clients | Projects | Planning | Time Tracking | Personnel | LeadsOverview (Dashboard)
Location: Reports > Overview (or click on the company logo at the top left)
You can customise your personal business dashboard with tiles – for example, focusing on invoicing or HR
To access the overview, a user needs full access to reports.
 (English image not yet available)
These tiles are displayed by default
- Cashflow & Liquidity Planning: Income and expenditures recorded and planned Click for detailed financial reports
- Hours: Planned and recorded project hours. Additionally, recorded absences are displayed.
- Total Invoiced: Sum of created invoices
Click for a filterable invoice list - Billable: Planned and currently billable services
- Not Yet Delivered: Indicates what still needs to be delivered. "How many sold hours have not yet been delivered" (Total project budgets minus proportional additional service budgets and already recorded hours).
- Billability: Billable hours in relation to target hours (From an employer's perspective: All absences are considered except for illness – which negatively impacts).
.png "Einstellungen Dashboard") (English image not yet available)
(English image not yet available)Additional selectable tiles
Finance
- Income/Expenditures: Shows the financial report in a compact form and is directly linked.
- Outstanding Invoices: Addresses the total outstanding amounts or by status and links directly to the filtered lists. For example, you can access the mass action for the dunning process with one click.
- Not Yet Invoiced: Compares the total of project budgets with the amounts already invoiced.
Invoices
- Invoiced by Client: Existing tile from Finance > Overview, which is planned to be removed from there in the long term. Displays the 4 clients with the largest invoice amounts. Helps identify potential concentration risks.
- Income – Gross Payments: Tile from the invoicing report. Shows the monthly recorded and planned payments. Links to the cashflow report, which breaks down the payments. Recorded payments are always accessible under "Invoicing" > "Payments".
- Income: Tile from the invoicing report. Shows created invoices and planned invoices – and can be traced in detail via the linked financial report.
Expenditures
- Expenditures: Tile from the expenditures report. Shows the recorded and planned expenditures monthly. Also includes fixed costs (net). Use the tooltip via mouseover for a quick info – or click on the title for a breakdown of individual items.
- Total Expenditures: Tile from the expenditures report. Recorded expenditures and how many of them are unpaid.
- Expenditures by Supplier: Existing tile under Finance > Overview, which is planned to be removed from there in the long term. Displays the 4 suppliers with the largest expenditure amounts.
- Outgoing – Gross Payments: Tile from the expenditures report. Shows the monthly recorded and planned payments. Includes info on composition via tooltip and direct linking to the cashflow report, which breaks down the payments. Recorded payments are always accessible under "Expenditures" > "Payments".
- Expenditures to be Transferred: Sum of expenditures still to be transferred (approved personal expenses reports and recorded incoming invoices).
- Remaining Expenditure Budgets: Control of recorded expenditure budgets. The four pots with the largest volume are displayed, and all other budgets are summarised under "Others".
Leads
- Weighted Leads: Tile from the lead report. Shows the current volume in the sales pipeline calculated over probabilities and informs about the volume without weighting below.
- Weighted Leads Monthly: Tile from the lead report. Shows the volume calculated over probabilities per month. Prerequisite is that a period is assigned to the lead.
- Completed Leads: Compact info on Leads > Completed. Indicates what volume was completed in the year. The completion date counts.
- Lead Volume Monthly: Monthly forecast of lead volume. Display as under "Leads" but here only for the relevant year.
Time Tracking
- Share of Billable Hours: Summarises the report under Reports > Time Tracking > Project Time. Indicates how many billable project hours were recorded compared to the total hours.
- Working Time Irregularities
Have you activated the display for irregularities in time tracking? Through the display of irregularities, you can better control via a visual display for the recorder and in the overall report whether there are deviations from legal requirements. If an employee records times on an absence day, this is also indicated. More on irregularities
Personnel
- Open Leave Requests: Shows open leave requests – and how many of them are addressed to you. By clicking on the number, you go directly to the list and can check the approval.
- Next Approved Leave Requests: Shows current and upcoming leaves (from leave requests).
- Upcoming Birthdays
Shows birthdays that have been recorded. By clicking on the title, you go to the complete birthday list in MOCO.
You decide whether to record birthdays in MOCO for personnel and contacts (GDPR relevant).
Finance: Overview
Location: Reports > Finance > Overview
Purchases are compared against invoices. By breaking down the line items (1), you can, for example, identify missed planned billings or forecast revenue for a client.
 (English image not yet available)
Income
Green: All invoices (net) by invoice date, from status Created through to Paid.
Grey: Currently billable items and planned income
Hatched: Weighted lead volume with an assigned time period (2)
Hatched: Weighted lead volume with an assigned time period (2)
Invoices, Billable Items and Planned
Filterable via “Categories”. All amounts are net.
- Invoices (by invoice date)
- Invoices – Drafts (draft date, or if in the past: today)
- Hours (billable hours from projects by effort > end of month)
- Additional services (billable additional services > end of month)
- Planned income (planned billing > key date + planned hours > end of month) How to plan income
Purchases
Pink: Recorded purchases (supplier invoices, approved personal expenses, and fixed costs net)
Grey: Planned purchases (general purchases, planned project purchases, and future fixed costs – provided purchase planning is enabled)
Grey: Planned purchases (general purchases, planned project purchases, and future fixed costs – provided purchase planning is enabled)
Purchases and Planned
Filterable via “Categories”. All amounts are net.
- Purchases (by invoice date)
- Planned purchases (by planned date) How to plan purchases
- Fixed costs (as of the key date)
Tips & Info
- All Net If you have stored a tax rate for fixed costs, this report uses the net amount (otherwise gross).
- Click to filter in the chart (key figures, monthly figure, bars) or via categories, time period, etc. (1)
- i for detailed information
- Exports: targeted export of your filters + billable items per project and month (3)
- Billable items in the past are set to today’s date and carried forward, on the assumption they will be billed soon. If billing is not possible, you should mark open items as already billed or tick off billing plans.
- Use the compact tile in your Business Dashboard linked here.
Further Reports
Report under Billing
More information about the report under “Billing”
Reports under Purchases
Location: Purchases > Reports & Budgets
More information about the report under “Purchases”
More information about the report under “Billing”
Reports under Purchases
Location: Purchases > Reports & Budgets
More information about the report under “Purchases”
Finance: Cashflow & Liquidity Planning
Location: Reports > Finance > Cashflow
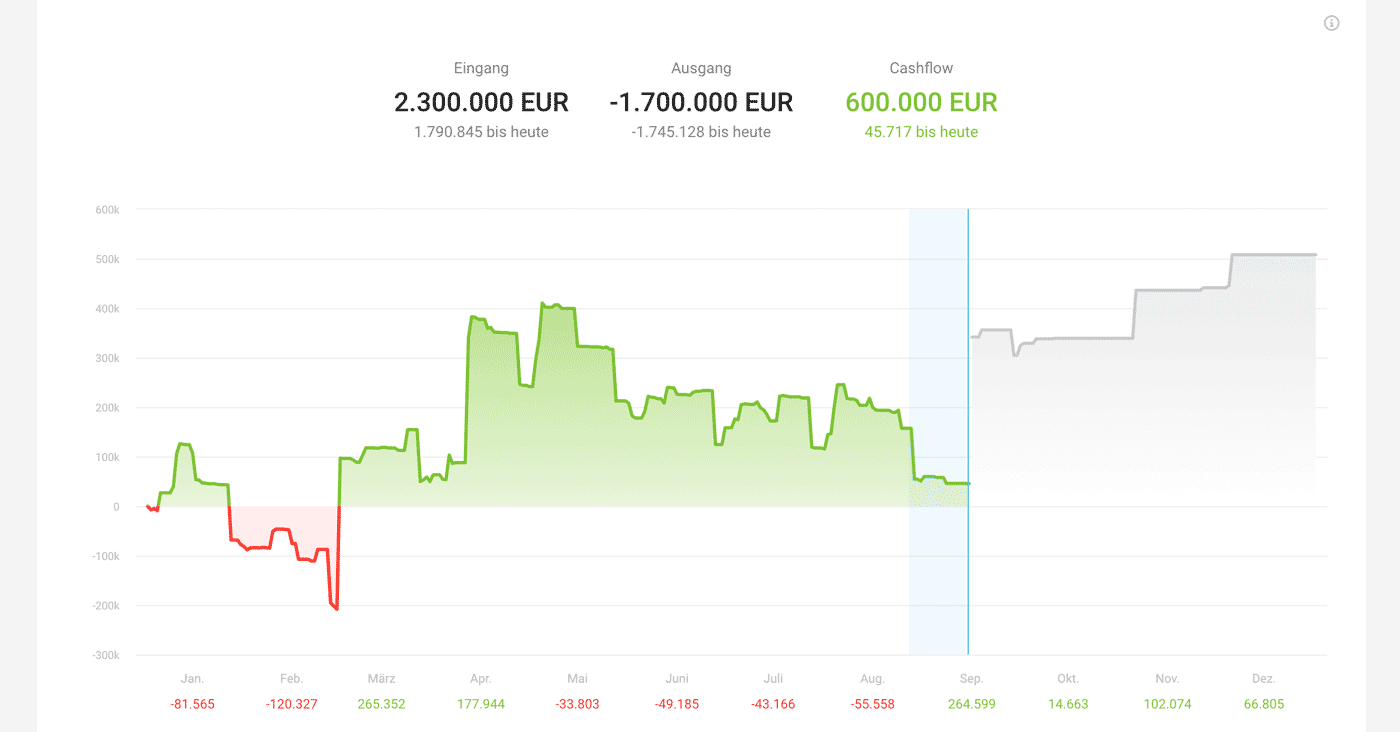
The "Cashflow" report shows all completed and planned payments. All amounts are gross (i.e. including tax).
 (English image not yet available)
.png "cashflow-liste") (English image not yet available)
(English image not yet available)Incoming
Filterable via "Categories". All amounts are gross (incl. VAT).
Income received + expected
- Payments (All recorded payments – see also Billing > Payments)
- Invoices (open) (Payable by)
- Invoices – Drafts (Draft date, or if in the past: today + payment terms)
- Hours (Billable hours from time & materials projects > end of month + payment terms)
- Additional services (Billable additional services > end of month + payment terms)
- Planned income: "Planned Billing" and "Planned Hours" from projects (depending on the billing type) > end of month + payment terms
Outgoing
Filterable via "Categories". All amounts are gross (incl. VAT).
Purchases made + expected
- Payments (All recorded payments – see also Purchases > Payments)
- Purchases (open) (up to the Payable By date)
- Planned purchases (on the Planned date + payment terms)
- Fixed costs (on the stored key date)
Tips & Info
- Breakdown via the chart
a) Period: Use your mouse to select a (particularly interesting or suspicious) period in the chart by dragging. The selected area turns blue (see the image above). The list shown below (1) then breaks down exactly that period.
b) Day: Clicking on a point filters all "events" for that day.
c) Figures: Clicking on the figures filters specifically for the related items. - Column sorting ascending and descending by clicking the column heading.
- "Days overdue" (2) shows how far apart the due date and the actual payment are. This is particularly helpful for paid invoices (clients’ payment behaviour) and open invoices.
- Export: You can easily export the filtered view in Excel format.
- To start with a specific amount, record a payment without an invoice under "Billing" > "Payments" > "+" (top right).
- To add billing plans to projects, use the smart filter "Without Billing Plan" in the project list.
- Add missing fixed costs and, if needed, enter the key date and tax rate.
- Automatic payment capture via bank connection or CAMT.
- If you don’t (yet) record incoming invoices in MOCO, you can store the total of (actual and planned) outgoing account movements under "Fixed Costs" to still assess your cashflow.
- Use the selectable, linked compact tile in your Business Dashboard.
Note: No payments, no cashflow
- If you don’t record any payments in MOCO, you can (e.g. monthly) set all outgoing or incoming invoices to paid with one click. This means the income is also visible in the cashflow chart. For incoming payments, automatic payment capture via bank connection or a CAMT file can support you.
Clients
Location: Reports > Clients
Revenue, Effective Hourly Rate & Profitability
 (English image not yet available)
- Use the Filter (1) to sort by labels, client managers, and specific time periods.
- The global figure displays the total invoiced amount. Additional global figures are shown under the "i" (2).
- All columns (3) can be sorted in ascending or descending order. Where applicable, figures are linked.
- In the top right, use the export (4) for further individual analyses if needed.
Projects
Location: Reports > Projects
Project Profitability
 (English image not yet available)
Project profitability indicates whether a project is in the black or red, considering current costs. The filter (1) and sorting options (2) allow for different perspectives.
Entire project duration or day-specific breakdown
By default, the project is viewed as a whole – alternatively, it can be broken down day-by-day using the filter. If the project is not fully invoiced, the budget amount serves as a comparison value for the entire period. This default setting can also be disabled, so only the actually invoiced amount is considered.
- The columns are sortable (1)
- The filter area offers various filter options: e.g., labels, invoicing type, project management (1).
- Additional values can be retrieved (even after filtering) via the "i" below the total profitability (4).
- The Excel export in the top right provides further evaluation options (3).
---------------
Important: To effectively use both profitability reports (projects and clients)
Important: To effectively use both profitability reports (projects and clients)
- store the internal hourly rates in the settings (Settings > Account > Internal Hourly Rates). If the internal hourly rates are incomplete, the person icon will be displayed in red – including hover info.
- record costs for additional services or assign expenditures
---------------
Planning
Location: Reports > Planning
MOCO gives you an overview of utilisation/capacity, plus another view showing whether work was completed as planned.
Utilisation
The “Utilisation” report shows, at a glance, the monthly percentage team utilisation (1), as well as the hours not yet scheduled per person (2) and per team (3). The smaller the bar, the more fully planned it is.
 (English image not yet available)
Provisionally Planned Projects
You can see at a glance how many hours remain after deducting the provisionally planned hours, per team (3). For each person, provisional planning is shown by the light-grey bar. For more detailed information, use the tooltip to see how many hours remain after deducting the provisionally planned hours (4).
Reservations for Leads
Planned leads are also taken into account. The tooltip shows how the planning is broken down in detail.
Reservations for Leads
Planned leads are also taken into account. The tooltip shows how the planning is broken down in detail.
For more detailed data for your own analysis, use the Excel Export at the top right.
Displays While Planning
In Planning, you can see the following utilisation information per person:
- Utilisation for the next 4 weeks
- Number of hours not yet scheduled per week or day (depending on zoom level)
Completed / Planned
While “Utilisation” shows how far capacity has been scheduled, “Completed / Planned” also answers whether work was actually carried out according to plan. For each person, all planned and completed hours are listed for the selected period.
The metric at the top (1) shows at a glance, overall, whether work on planned projects matches what was planned. By default, the period (2) is set to the previous week.
 (English image not yet available)
The list (3) breaks this down and shows, per person and project: completed hours, planned hours, the difference between them, and the completion rate as a percentage (completed / planned). The bar visualisation makes it easy to scan.
If hours were logged against a project that was not planned in capacity planning, no bar is shown. These hours are also not included in the summary metric.
The metric at the top (1) shows at a glance, overall, whether work on planned projects matches what was planned. By default, the period (2) is set to the previous week.
(English image not yet available)The list (3) breaks this down and shows, per person and project: completed hours, planned hours, the difference between them, and the completion rate as a percentage (completed / planned). The bar visualisation makes it easy to scan.
If hours were logged against a project that was not planned in capacity planning, no bar is shown. These hours are also not included in the summary metric.
Use the filter (2) to narrow down by people and projects. You can also export (4) the filtered view as an XLS file.
Time Tracking
Location: Reports > Time Tracking
Overview, Project Time, Working Time
Overview, Project Time, Working Time
Overview
 (English image not yet available)
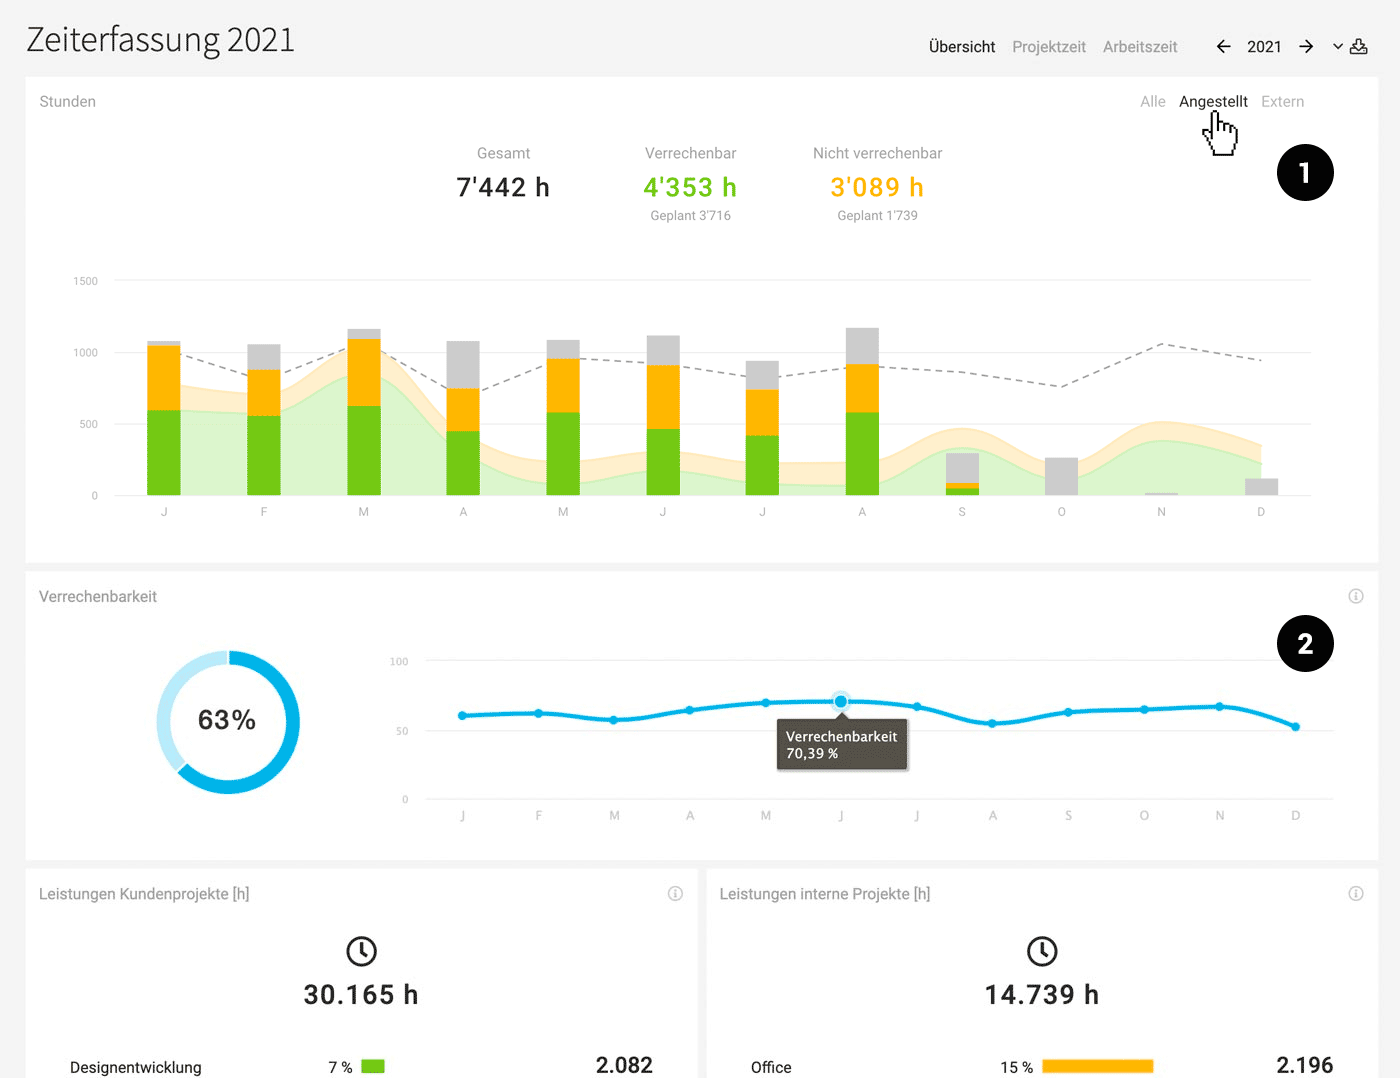
Hours (1)
Total hours worked, monthly, billable, non-billable, vs. planned hours, vs. Target (when filtered by employee).
Billability (2)
Billability across the entire company, both total and monthly. A similar analysis is available in the Team Report and Personnel Report. (billable hours in relation to the Target – can be broken down via the export Reports > Personnel).
Services for Client and Internal Projects: Distribution of recorded hours across the services.
Project Time
 (English image not yet available)
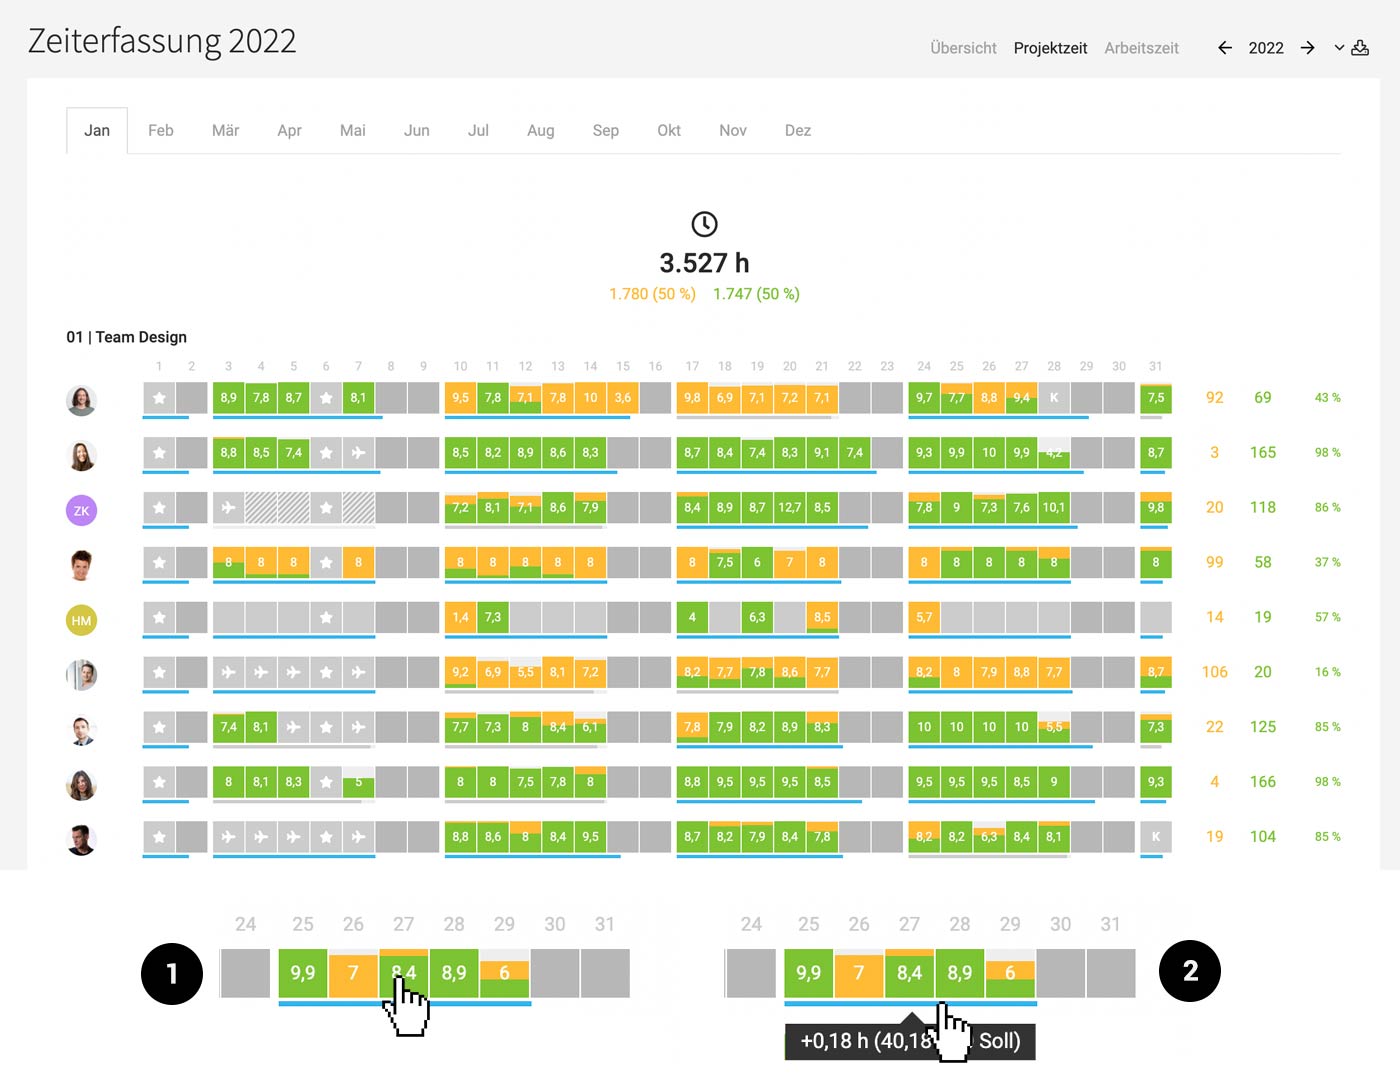
The overview of time tracking across all employees
Clicking on a monthly bar in the company report "Hours" leads directly to this report.
Ratio of Billable and Non-Billable Hours
The illustrative representation of recorded billable and non-billable hours shows how they relate and develop – per person and across the team.
The illustrative representation of recorded billable and non-billable hours shows how they relate and develop – per person and across the team.
Details per Day
Clicking on a day provides the view of a Timesheet (1).
Weekly Target-Actual Comparison
Below each week, the progress bar is displayed, which is also available for each employee in the time tracking. It indicates whether the week's target has been reached or not. This allows for a quicker check if all hours have been logged.
Grey = Target not reached.
Blue = Target reached or exceeded.
Hovering over shows the detailed info (2).
Global Hour Export per Month and Year
There is an Excel export for personal evaluations at the top right.
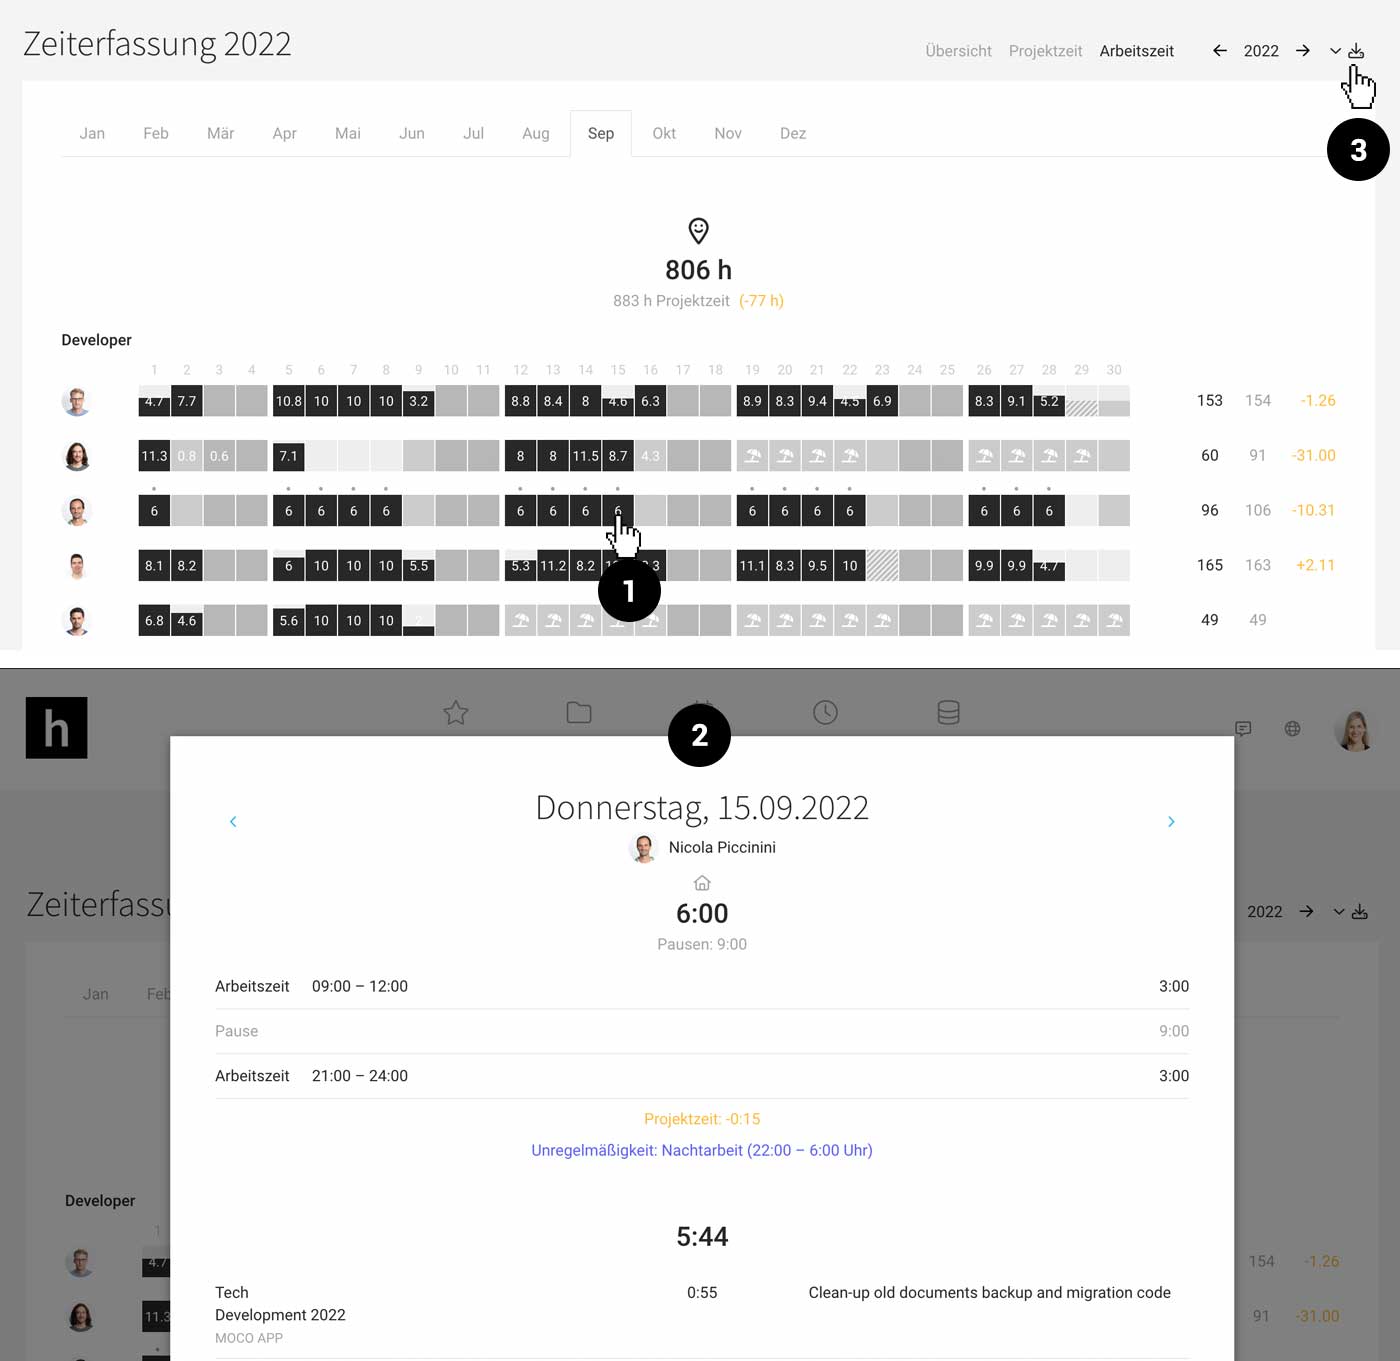
Working Time
Overview of recorded working time per month, day, person. Displayed when working time tracking is activated for at least one person.
Clicking on the day (1) provides the details (2).
 (English image not yet available)
Global Export (Excel) of Working Times (Excel) per month and year: top right (3).
If settings choose that the Target-Actual Comparison should be calculated based on working time, the progress bar will be displayed in this report.
Clicking on the day (1) provides the details (2).
(English image not yet available)Global Export (Excel) of Working Times (Excel) per month and year: top right (3).
If settings choose that the Target-Actual Comparison should be calculated based on working time, the progress bar will be displayed in this report.
Personnel
Location: Reports > Personnel
Target-Actual & Billability
Target-Actual per person and month, total balance
Billability per person and year
Export at the top right with comprehensive content
Billability per person and year
Export at the top right with comprehensive content
Leave
Leave days per person and month, total balance
Sick days per person and year
Export at the top right
Sick days per person and year
Export at the top right
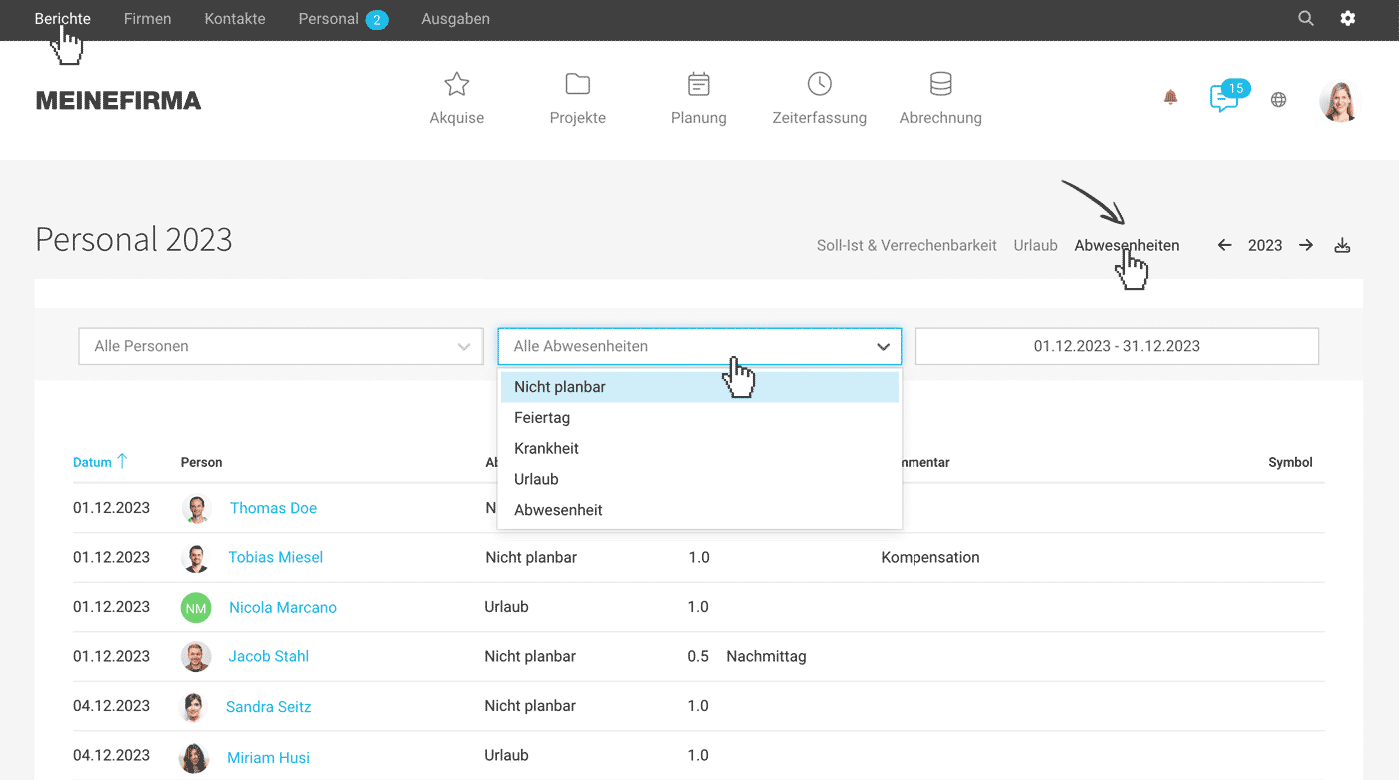
Absences
Filterable and sortable list per person and month, total balance
All types of absences per day with traceable comments
Export (pre-filterable) at the top right
 (English image not yet available)
All types of absences per day with traceable comments
Export (pre-filterable) at the top right
(English image not yet available)Leads
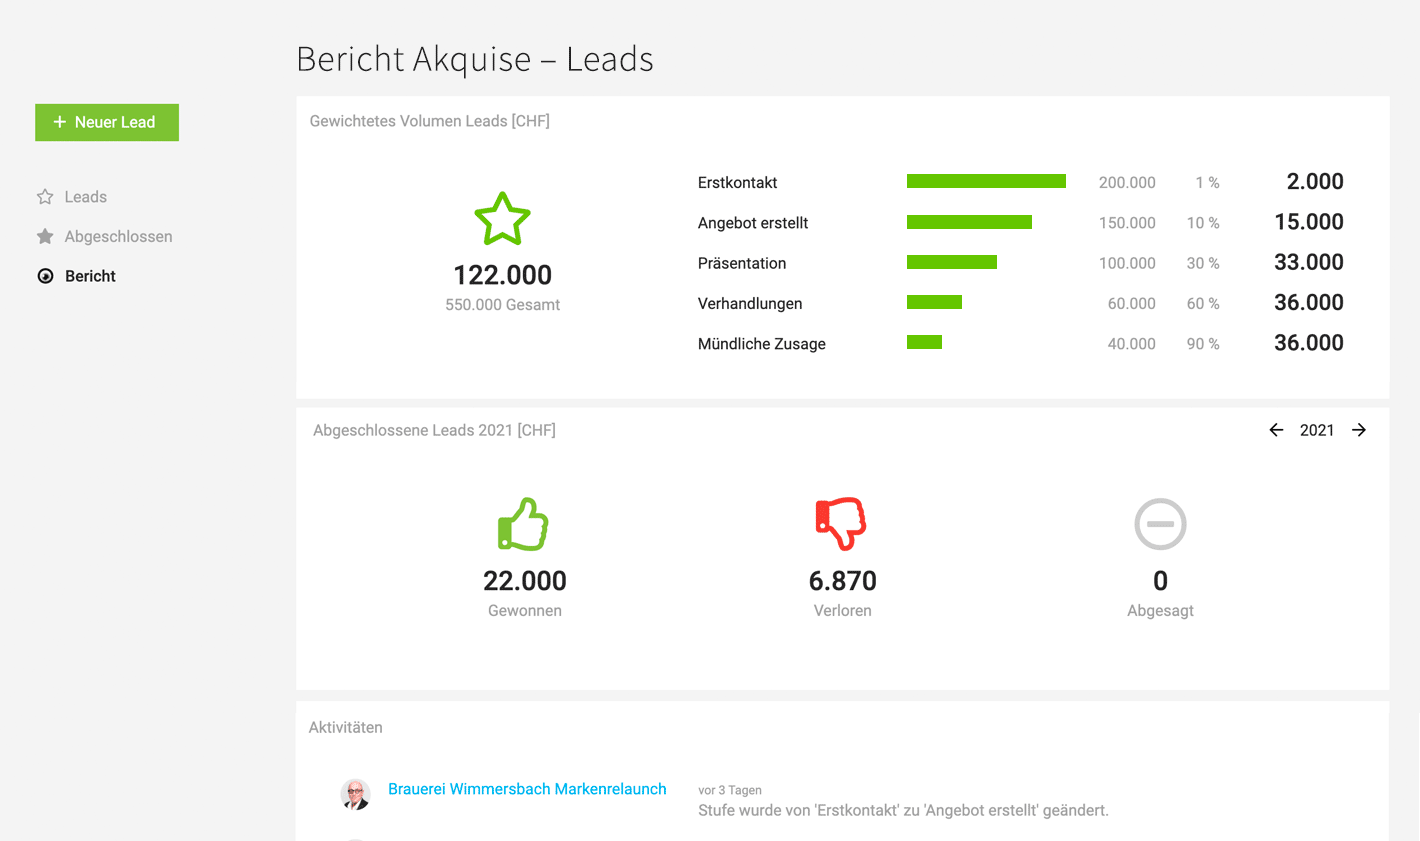
Location: Acquisition > Leads > Report
Report on future revenue in the pipeline and sales activities.
Total and weighted lead volume
Acquisition stages displayed as a sales funnel with proportional volumes
Completed leads won vs. lost or cancelled
Activities provides a concise overview of recent sales activities.
 (English image not yet available)
Report on future revenue in the pipeline and sales activities.
Total and weighted lead volume
Acquisition stages displayed as a sales funnel with proportional volumes
Completed leads won vs. lost or cancelled
Activities provides a concise overview of recent sales activities.
(English image not yet available)