Alter News-Artikel!
» Hier geht's zur aktuellen Online-Hilfe
Article from
Leads: Potential New Business per Month – Visual and Numerical Insights.
You can now set the expected implementation period for leads and see how the anticipated projects are distributed across the months.
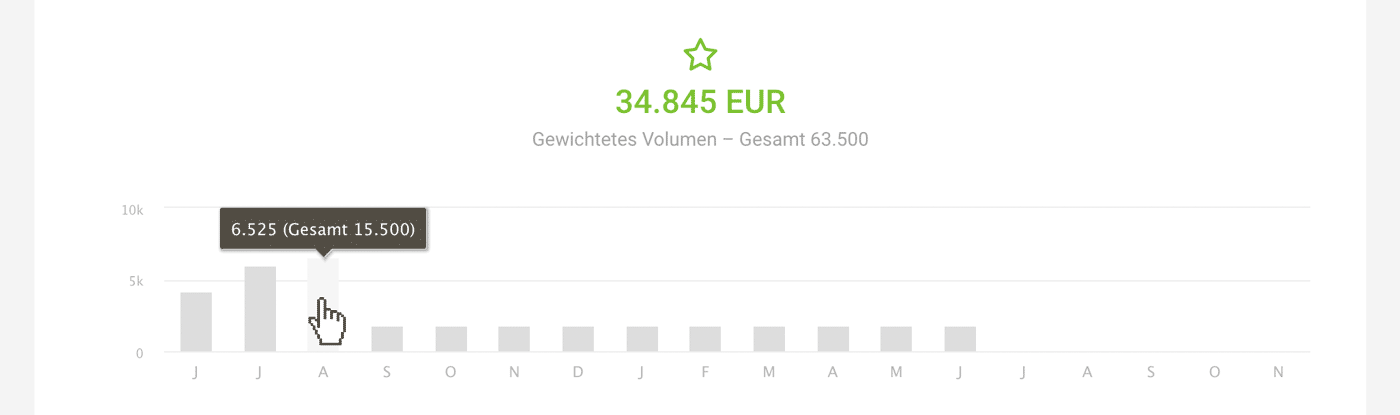
Once you set the period for at least one lead, a preview graphic appears, which remains in focus even when working in the list. The period can also be quickly adjusted via a click in the list. See video:
View Only Your Leads
If you filter only your leads using Q (keyboard shortcut or the filter at the top right), the preview adjusts accordingly.
Display in Financial Report
The weighted volume (probable revenue – in the example 34,845 EUR) is displayed in the financial report as a sum under "Planned Billable" for orientation.
Not using leads yet and want to learn more about reliably converting inquiries into deals? Find all the information on lead management here.